René Cutura Profile Avatar

Hello,

my name is René Cutura.

I am a full-stack developer with a scientific focus on data visualization. Specialized since 2018 in the design and implementation of interactive web visualizations. I combine analytical algorithm development with user-centered UI design to present complex datasets reliably and comprehensibly.

GitHub Repository

ISilDR

Isometric Seriation-based Dimensionality Reduction for Visual Cluster Analysis

  • René Cutura
  • Sophie Sadler
  • Quynh Quang Ngo
  • Michaël Aupetit
  • Michael Sedlmair

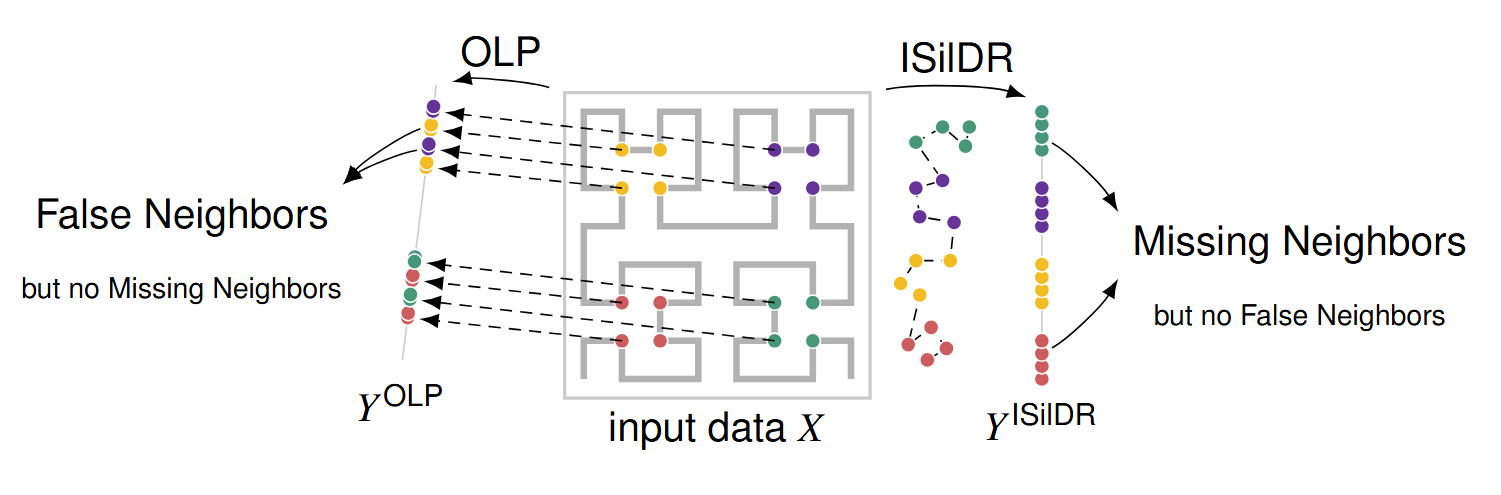
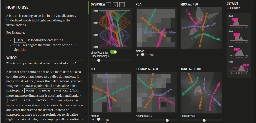
Abstract: Visual cluster analysis is a central task in exploring multidimensional (MD) data, typically supported by Dimensionality Reduction (DR) techniques that spatialize MD data similarities as point patterns in scatterplots. However, these layouts are often limited by unavoidable distortions—specifically false neighbors (where separated clusters appear to overlap) and missing neighbors (where true clusters are split into falsely separated groups). In this work, the authors propose Isometric Seriation-based Dimensionality Reduction (ISilDR), a family of techniques that provably generate at most missing neighbors. This contrasts with orthogonal linear projections (OLP) like Principal Component Analysis (PCA), which never produce missing neighbors but do produce false neighbors. ISilDR creates a seriation of MD data points (an ordering along a 1D projection axis) and spaces consecutive points by their MD distance. An mD ISilDR can be obtained by combining m 1D ISilDRs. The authors provide a systematic, formal analysis using epsilon-neighborhood graphs to study the theoretical and empirical characteristics of ISilDR and OLP variants. They derive rules for discovering true MD cluster patterns by interactively linking ISilDR and OLP coordinated layouts, illustrating through case studies how this combination enables more trustworthy visual cluster analysis.

GitHub Repository YouTube Presentation

SiGrid

Gridifying Scatterplots with Sector-Based Regularization and Hagrid

  • René Cutura
  • Hennes Rave
  • Quynh Quang Ngo
  • Vladimir Molchanov
  • Lars Linsen
  • Daniel Weiskopf
  • Michael Sedlmair

Abstract: Hagrid is a state-of-the-art space-filling-curve-based method for gridifying scatterplots. However, it exhibits limitations in preserving the global structures of scatterplots with areas of varying density due to the incompatibility of adapting the granularity level of the underlying space-filling curve to regions with different densities. To compensate for this shortcoming, we introduce SiGrid that combines Hagrid with the Sector-Based Regularization (SBR) technique. SiGrid applies SBR to generate a scatterplot with a more uniform and generally lower density as an intermediate step. This intermediate scatterplot can then be fed to Hagrid for improved results. We quantitatively evaluate SiGrid by comparing it to Hagrid over a set of 502 scatterplots of different sizes, ranging from 50 to 10000 points per dataset, using relevant quality metrics. While generally slower, the results demonstrate that SiGrid outperforms Hagrid regarding the quality metrics of rank-wise neighborhood preservation (trustworthiness), ordering preservation, and pairwise distance preservation (cross-correlation).

GitHub Repository

Hagrid

Using Hilbert and Gosper Curves to Gridify Scatterplots

  • René Cutura
  • Cristina Morariu
  • Zhanglin Cheng
  • Yunhai Wang
  • Daniel Weiskopf
  • Michael Sedlmair

Abstract: A common enhancement of scatterplots represents points as small multiples, glyphs, or thumbnail images. As this encoding often results in overlaps, a general strategy is to alter the position of the data points, for instance, to a grid-like structure. Previous approaches rely on solving expensive optimization problems or on dividing the space that alter the global structure of the scatterplot. To find a good balance between efficiency and neighborhood and layout preservation, we propose HAGRID, a technique that uses space-filling curves (SFCs) to “gridify” a scatterplot without employing expensive collision detection and handling mechanisms. Using SFCs ensures that the points are plotted close to their original position, retaining approximately the same global structure. The resulting scatterplot is mapped onto a rectangular or hexagonal grid, using Hilbert and Gosper curves. We discuss and evaluate the theoretic runtime of our approach and quantitatively compare our approach to three state-of-the-art gridifying approaches, DGRID, Small multiples with gaps SMWG, and CorrelatedMultiples CMDS, in an evaluation comprising 339 scatterplots. Here, we compute several quality measures for neighborhood preservation together with an analysis of the actual runtimes. The main results show that, compared to the best other technique, HAGRID is faster by a factor of four, while achieving similar or even better quality of the gridified layout. Due to its computational efficiency, our approach also allows novel applications of gridifying approaches in interactive settings, such as removing local overlap upon hovering over a scatterplot.

DaRt

Generative Art using Dimensionality Reduction Algorithms

  • René Cutura
  • Katrin Angerbauer
  • Frank Heyen
  • Natalie Hube
  • Michael Sedlmair

Abstract: Dimensionality Reduction (DR) is a popular technique that is often used in Machine Learning and Visualization communities to analyze high-dimensional data. The approach is empirically proven to be powerful for uncovering previously unseen structures in the data. While observing the results of the intermediate optimization steps of DR algorithms, we coincidently discovered the artistic beauty of the DR process. With enthusiasm for the beauty, we decided to look at DR from a generative art lens rather than their technical application aspects and use DR techniques to create artwork. Particularly, we use the optimization process to generate images, by drawing each intermediate step of the optimization process with some opacity over the previous intermediate result. As another alternative input, we used a neural-network model for face-landmark detection, to apply DR to portraits, while maintaining some facial properties, resulting in abstracted facial avatars. In this work, we provide such a collection of such artwork.

GitHub Repository YouTube Presentation Video

Hagrid

Gridify Scatterplots with Hilbert and Gosper Curves

  • René Cutura
  • Cristina Morariu
  • Zhanglin Cheng
  • Yunhai Wang
  • Daniel Weiskopf
  • Michael Sedlmair

Abstract: A common enhancement of scatterplots represents points as small multiples, glyphs, or thumbnail images. As this encoding often results in overlaps, a general strategy is to alter the position of the data points, for instance, to a grid-like structure. Previous approaches rely on solving expensive optimization problems or on dividing the space that alter the global structure of the scatterplot. To find a good balance between efficiency and neighborhood and layout preservation, we propose Hagrid, a technique that uses space-filling curves (SFCs) to “gridify” a scatterplot without employing expensive collision detection and handling mechanisms. Using SFCs ensures that the points are plotted close to their original position, retaining approximately the same global structure. The resulting scatterplot is mapped onto a rectangular or hexagonal grid, using Hilbert and Gosper curves. We discuss and evaluate the theoretic runtime of our approach and quantitatively compare our approach to three state-of-the-art gridifying approaches, DGrid, Small multiples with gaps SMWG, and CorrelatedMultiples CMDS, in an evaluation comprising 339 scatterplots. Here, we compute several quality measures for neighborhood preservation together with an analysis of the actual runtimes. The main results show that, compared to the best other technique, Hagrid is faster by a factor of four, while achieving similar or even better quality of the gridified layout. Due to its computational efficiency, our approach also allows novel applications of gridifying approaches in interactive settings, such as removing local overlap upon hovering over a scatterplot.

Illegible Semantics

Exploring the Design Space of Metal Logos

  • Gerrit J. Rijken
  • René Cutura
  • Frank Heyen
  • Michael Sedlmair
  • Michael Correll
  • Jason Dykes
  • Noeska Smit

Abstract: The logos of metal bands can be by turns gaudy, uncouth, or nearly illegible. Yet, these logos work: they communicate sophisticated notions of genre and emotional affect. In this paper we use the design considerations of metal logos to explore the space of "illegible semantics": the ways that text can communicate information at the cost of readability, which is not always the most important objective. In this work, drawing on formative visualization theory, professional design expertise, and empirical assessments of a corpus of metal band logos, we describe a design space of metal logos and present a tool through which logo characteristics can be explored through visualization. We investigate ways in which logo designers imbue their text with meaning and consider opportunities and implications for visualization more widely.

DumbleDR

Predicting User Preferences of Dimensionality Reduction Projection Quality

  • Cristina Morariu
  • Adrien Bibal
  • René Cutura
  • Benoît Frenéy
  • Michael Sedlmair

Abstract: A plethora of dimensionality reduction techniques have emerged over the past decades, leaving researchers and analysts with a wide variety of choices for reducing their data, all the more so given some techniques come with additional parametrization (e.g. t-SNE, UMAP, etc.). Recent studies are showing that people often use dimensionality reduction as a black-box regardless of the specific properties the method itself preserves. Hence, evaluating and comparing 2D projections is usually qualitatively decided, by setting projections side-by-side and letting human judgment decide which projection is the best. In this work, we propose a quantitative way of evaluating projections, that nonetheless places human perception at the center. We run a comparative study, where we ask people to select ‘good’ and ‘misleading’ views between scatterplots of low-level projections of image datasets, simulating the way people usually select projections. We use the study data as labels for a set of quality metrics whose purpose is to discover and quantify what exactly people are looking for when deciding between projections. With this proxy for human judgments, we use it to rank projections on new datasets, explain why they are relevant, and quantify the degree of subjectivity in projections selected.

GitHub Repository

DruidJS

A JavaScript Library for Dimensionality Reduction

  • René Cutura
  • Christoph Kralj
  • Michael Sedlmair

Abstract: Dimensionality reduction (DR) is a widely used technique for visualization. Nowadays, many of these visualizations are developed for the web, most commonly using JavaScript as the underlying programming language. So far, only few DR methods have a JavaScript implementation though, necessitating developers to write wrappers around implementations in other languages. In addition, those DR methods that exist in JavaScript libraries, such as PCA, t-SNE, and UMAP, do not offer consistent programming interfaces, hampering the quick integration of different methods. Toward a coherent and comprehensive DR programming framework, we developed an open source JavaScript library named DruidJS. Our library contains implementations of ten different DR algorithms, as well as the required linear algebra techniques, tools, and utilities.

GitHub Repository YouTube Presentation Video

Compadre

Comparing and Exploring High-Dimensional Data with Dimensionality Reduction Algorithms and Matrix Visualizations

  • René Cutura
  • Michaël Aupetit
  • Jean-Daniel Fekete
  • Michael Sedlmair

Abstract: We propose Compadre, a tool for visual analysis for comparing distances of high-dimensional (HD) data and their low-dimensional projections. At the heart is a matrix visualization to represent the discrepancy between distance matrices, linked side-by-side with 2D scatterplot projections of the data. Using different examples and datasets, we illustrate how this approach fosters (1) evaluating dimensionality reduction techniques w.r.t. how well they project the HD data, (2) comparing them to each other side-by-side, and (3) evaluate important data features through subspace comparison. We also present a case study, in which we analyze IEEE VIS authors from 1990 to 2018, and gain new insights on the relationships between coauthors, citations, and keywords. The coauthors are projected as accurately with UMAP as with t-SNE but the projections show different insights. The structure of the citation subspace is very different from the coauthor subspace. The keyword subspace is noisy yet consistent among the three IEEE VIS sub-conferences.

ValidVis

We collected austria's parliamentary speeches from 1996 to 2018. With the browser, you can read the speeches together with highlighted interruptions of other members of the parliament. The interruptions visualization shows all interruptions, incoming or outgoing, per member of the parliament.

VisCoDeR

A tool for Visually Comparing Dimensionality Reduction Algorithms

  • René Cutura
  • Stefan Holzer
  • Michaël Aupetit
  • Michael Sedlmair

Abstract: We propose VisCoDeR, a tool that leverages comparative visualization to support learning and analyzing different dimensionality reduction (DR) methods. VisCoDeR fosters two modes. The Discover mode allows to qualitatively compare several DR results by juxtaposing and linking the resulting scatterplots. The Explore mode allows for analyzing hundreds of differently parameterized DR results in a quantitative way. We present case studies that show that our approach helps to understand similarities and differences between DR algorithms.

SpotiVis

VIS-Course: A prototype to examine a part of the spotify database.

Project for the VIS-Course